Institutional Corruption:
The 2026 Update
Ten years ago I built a computer simulation of how money warps American politics. This is the update — new data through 2024, a corrected model, and an honest answer about what it would take to break the cycle.
- The vicious circle
- What I got wrong in 2015
- The data, sector by sector — campaign money, lobbying, voters, income, policymaking
- The model, recalibrated
- What would it take?
- The honest bottom line
The vicious circle
Running for office costs a fortune, so politicians spend their time courting big donors instead of voters. The donors get what they want; everyone else gets ignored. That rigs the economy toward the rich, which makes regular people give up on politics — which hands even more power to the donors. It’s a vicious circle, and it works the same from city hall to Congress.

CorrectionWhat I got wrong in 2015
The original study’s headline stat was that max-out elite donors gave 233 times what small donors (under $200) gave. That number was wrong — the data source I relied on undercounted small-dollar contributions roughly 11-to-1. Recomputed from raw FEC filings, the true 2014 ratio was about 19-to-1 — and by 2020, small donors outgave elite max-out donors to House campaigns ($234M vs $216M).
Online fundraising transformed who funds campaigns. The old model had no mechanism for it, so I built one — and recalibrated everything on the corrected data.
EvidenceThe data, sector by sector
Five sectors, sixty years of data, all refreshed through 2024. Here’s what each one shows.
Sector 1 — Campaign financeThe money chase
The price of admission keeps rising: total spending nearly quadrupled while the field of candidates grew by half. Against that backdrop, the composition of the money changed dramatically:
| 2014 | 2024 | Growth | |
|---|---|---|---|
| Small-dollar (<$200) | $7.9M | $195.9M | 24.7x |
| Elite (max-out donors) | $147.6M | $214.6M | 1.45x |
| PACs | $299.5M | $356.5M | 1.19x |
| Elite + PAC combined | $447M | $571M | 1.28x |
Big money still outspends small donors about 3-to-1 in absolute dollars — but small-dollar grew 25x while big money grew 1.3x. The dominance collapsed even though the dollars still favor elites.
And the House is only part of the picture. Here’s what each level raised in 2024:
| Race | Raised (2024) | Spent (2024) |
|---|---|---|
| House (all candidates) | $2.27B | $2.14B |
| Senate (all candidates) | $1.51B | $1.55B |
| President (all candidates) | $2.68B | $2.69B |
| Outside groups (Super PACs, dark money) | $4.50B — more than any of them | |
Total cost of the 2024 federal elections: $14.8 billion — roughly a hundred dollars for every American who voted, nearly five times the $3.1 billion price tag in 2000.
Sector 2 — LobbyingInfluence for sale
The influence industry grows regardless of who funds campaigns. Lobbying spending hit a record $4.44 billion in 2024 — and this is the sector the campaign-finance debate usually misses. You can reform who pays for elections without touching who gets heard after them. That distinction turns out to be the whole ballgame (see the scenarios).
Sector 2b — Outside spendingThe Super PAC bypass
This is the channel the original model missed entirely — it was built just as Citizens United (2010) unleashed it. Super PACs and dark-money groups can spend unlimited amounts to elect or destroy candidates, and they now outspend the candidates themselves. I’ve added it to the model as its own influence channel: at 2024 levels, it amplifies elite influence roughly 1.7x, and none of the tested reforms reach it — vouchers and matching fund candidates, and process reforms target legislating, but outside spending is constitutionally protected speech under current law. It’s a bypass around everything else. That’s why every scenario below is weaker than previously estimated — and more honest.
Sector 3 — VotersThe engagement gap
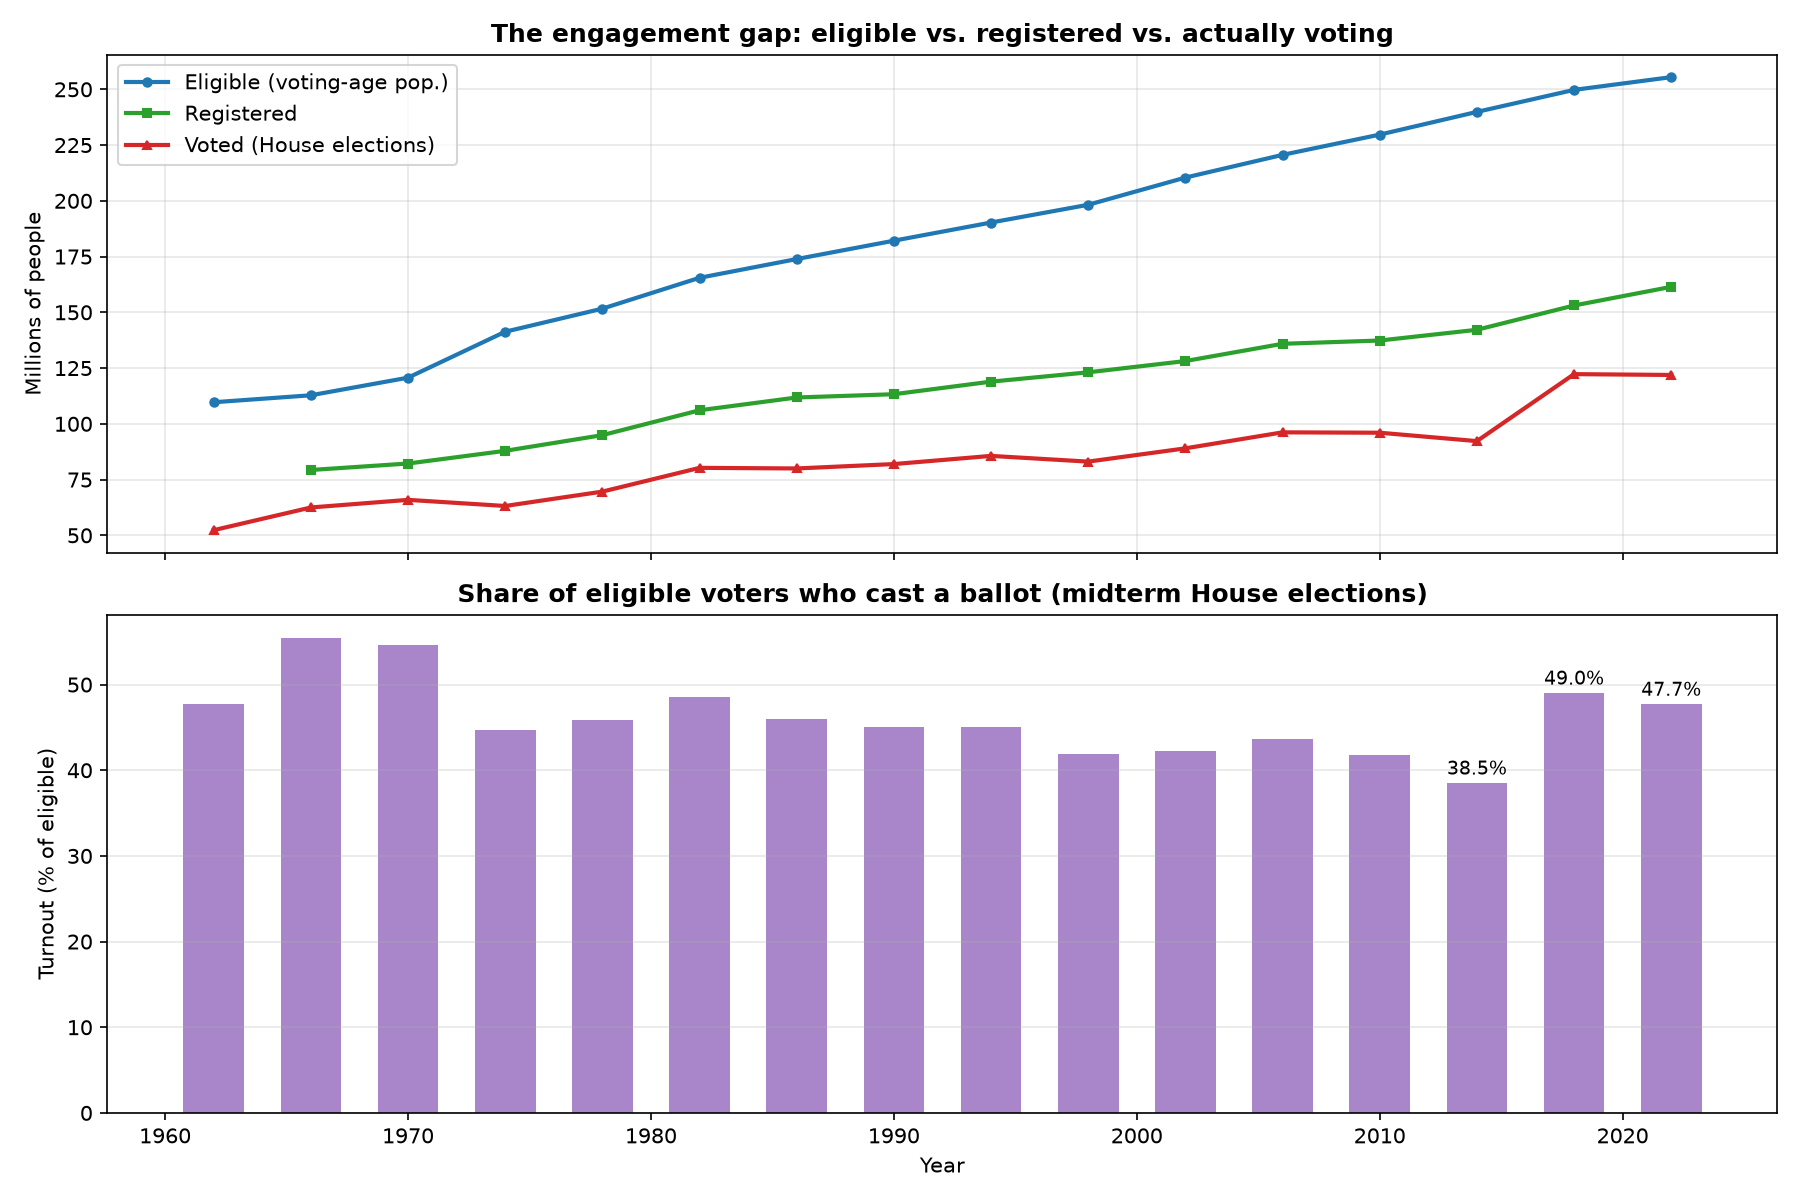
This is the engagement story in one picture: the country keeps adding eligible voters, registration roughly keeps pace — but in midterm House elections, fewer than half show up. 2014’s 38.5% was the modern bottom; the 2018 rebound to 49% was real but partial. When most voters sit out, the donors who never sit out matter more. That’s the mechanism, not a metaphor.
Sector 4 — Income & taxThe divide
Policy tilts, and the gains concentrate: the top decile now takes more than half of all income, the top-5%-to-middle-class gap nearly doubled, and the top tax rate fell from 91% to 37% over the same span. This is the output of the circle — the biased policy the model’s favoritism mechanism produces — and it feeds back in, because concentrated wealth concentrates political voice.
Sector 5 — PolicymakingWho actually makes the rules
Congress legislates less — bills passed fell by two-thirds since 1950 — while the Federal Register grew sevenfold to a record 107,262 pages. Policymaking migrated out of the legislature and into agencies, courts, and the lobbying apparatus around them. That migration is exactly what “reducing elite leverage” means in the model: it’s not about who funds campaigns, it’s about how policy gets made — and it’s the lever the finance reforms can’t pull.
The modelRecalibrated on the corrected data
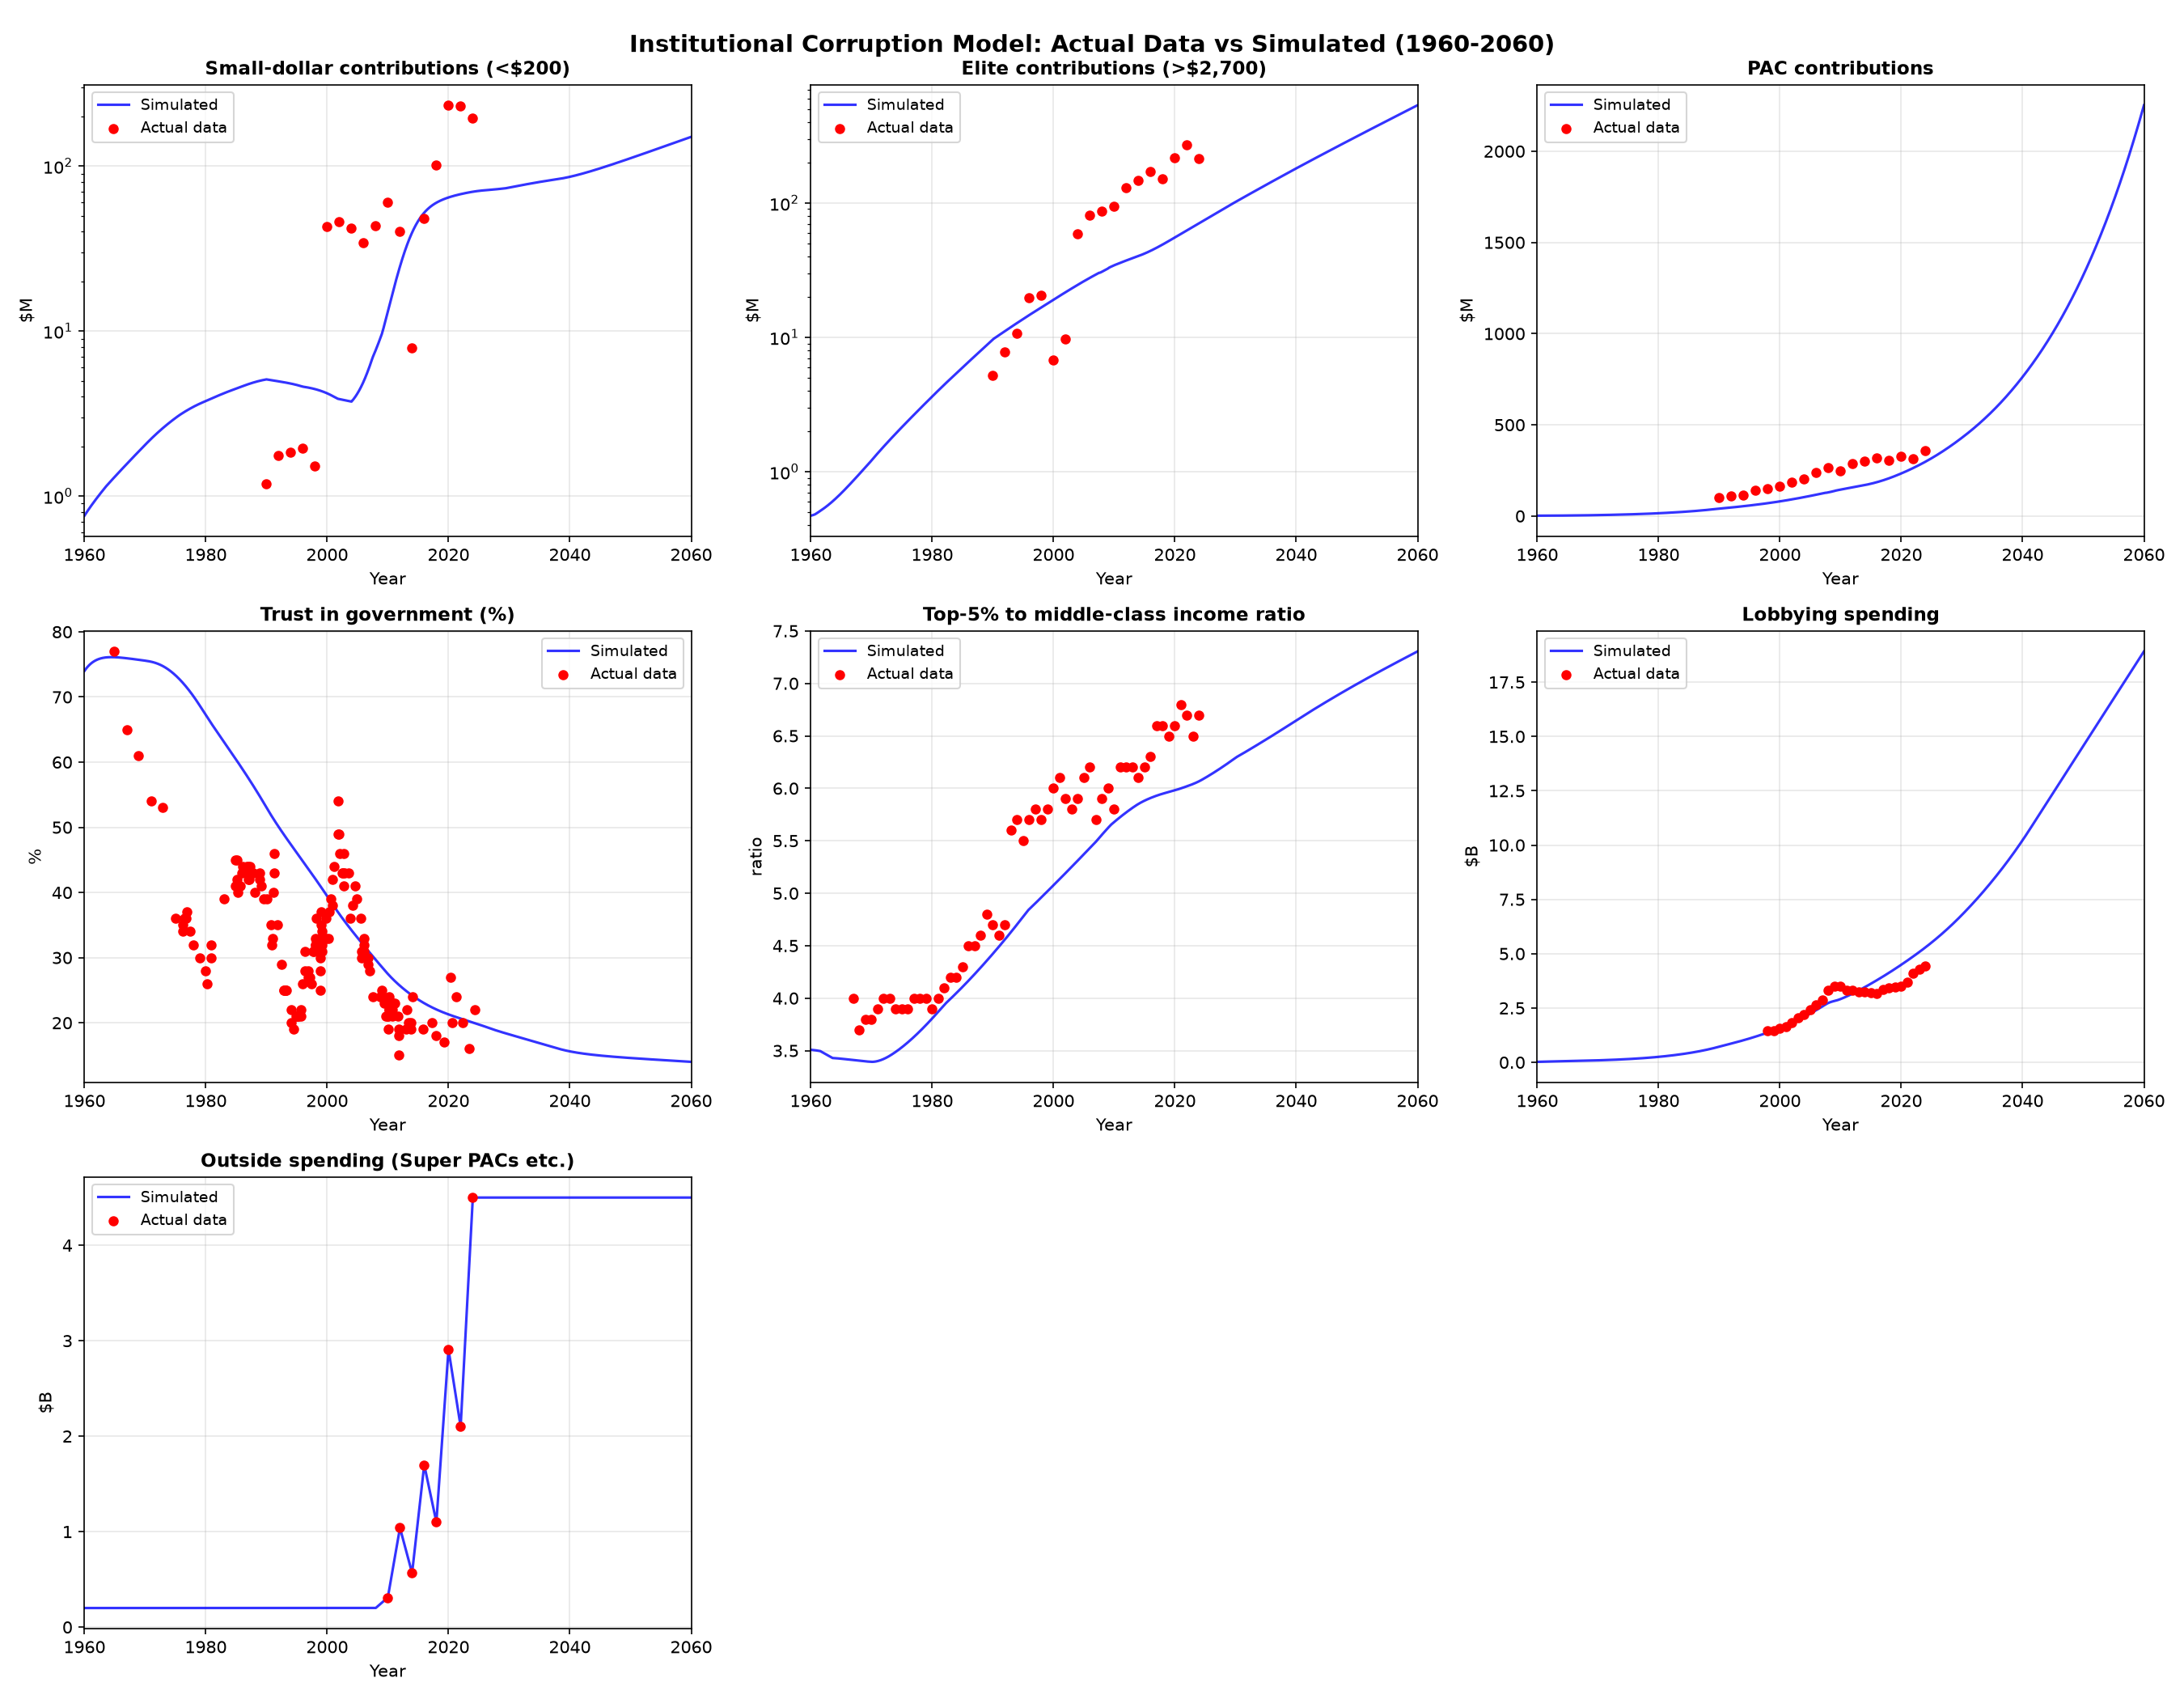
The old calibration had absorbed the phantom 233:1 ratio into its parameters — the model was fitted to a world that never existed. Correcting two parameters (the normal elite-contribution ratio and the online-fundraising mechanism) restored the dynamics. Trust now falls to ~20% instead of getting stuck near 50%; inequality reaches 6.5 against 6.7 observed.
ScenariosWhat would it take?
Four paths from 2027, measured by public trust in government in 2060:
| Scenario | Trust in 2060 | What it means |
|---|---|---|
| Do nothing | 14.0% | The bleak baseline. Trust keeps sliding. |
| Finance reforms (vouchers + 9:1 small-dollar match + cost controls) | 36.6% | +23 points. Still the strongest lever — but blunted, because reforms can’t touch outside spending. |
| Reduce elite leverage over policymaking | 17.2% | +3 points. The transparency fix is largely bypassed — Super PACs give elites an alternate path to the same influence. |
| Everything combined | 51.4% | +37 points. Still breaks 50% — a credible recovery path, but narrower than before. |
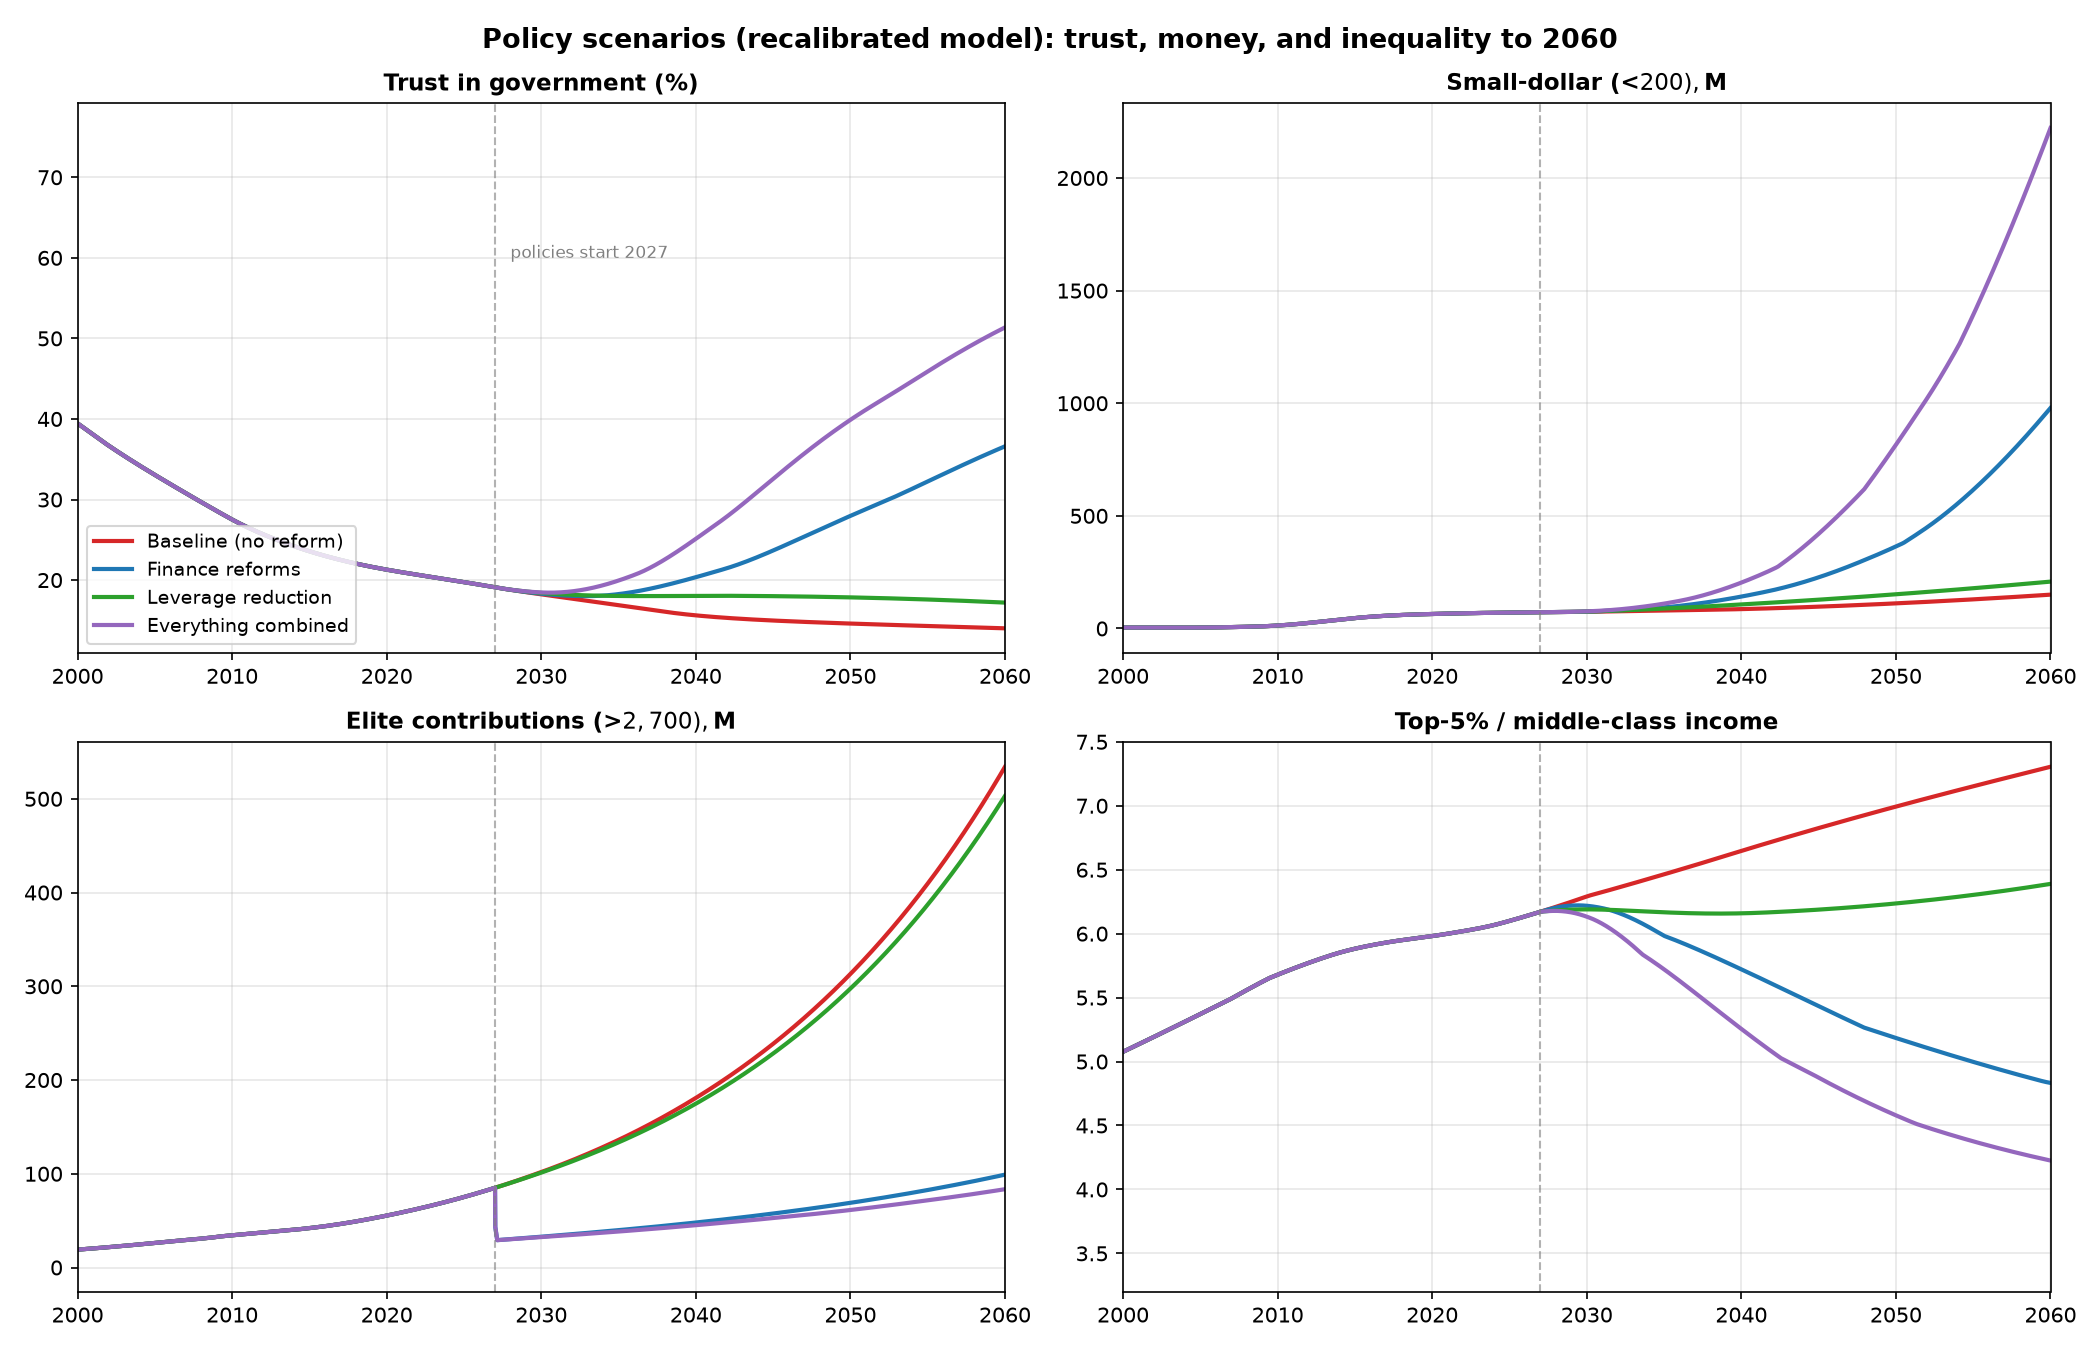
The key insight, updated: trust isn’t driven by campaign money directly — it’s driven by who policy favors. And there are now three channels of elite influence, not two: direct contributions, lobbying ($4.4B), and outside spending ($4.5B) — and the third one bypasses every reform tested here. Finance reform still cuts elite contributions nearly in half, but Super PACs pick up the slack. The money is a symptom; the policy outcomes are the disease; and the disease now has a backup immune system. That’s why the combined package is the only path — and why even it tops out lower than we’d like.
No single reform breaks the cycle. But the combination — public money big enough to displace elite money, plus cost controls, plus less leverage for donors over the legislative process — does. Getting back to 75% trust is aspirational; getting past 50% is achievable — and the Super PAC bypass is the reason it isn’t higher.
TakeawayThe honest bottom line
Small donors proved ordinary citizens will fund campaigns at scale. That means reforms amplifying their voice have a real constituency. But democratizing fundraising without democratizing access doesn’t fix the core problem — a $25 online donation doesn’t get you a meeting; the max-out donor and the lobbyist still do.
The story shifted from “elites buy elections” (depressing, disempowering) to “the system forces everyone to chase money” (structural, fixable). That’s more hopeful — and more honest.
FilesExplore the work
Data and model (2026 update, ZIP) — corrected data through 2024, recalibrated model, scenario runs, charts, and full source documentation.
Back to the original 2015 research